Management Rights Market Update - North Gold Coast
RAAS Management Rights Market Research
by Tony Ede - Management Rights Broker
Market Snapshot June 2022 Gold Coast - “North of the River”
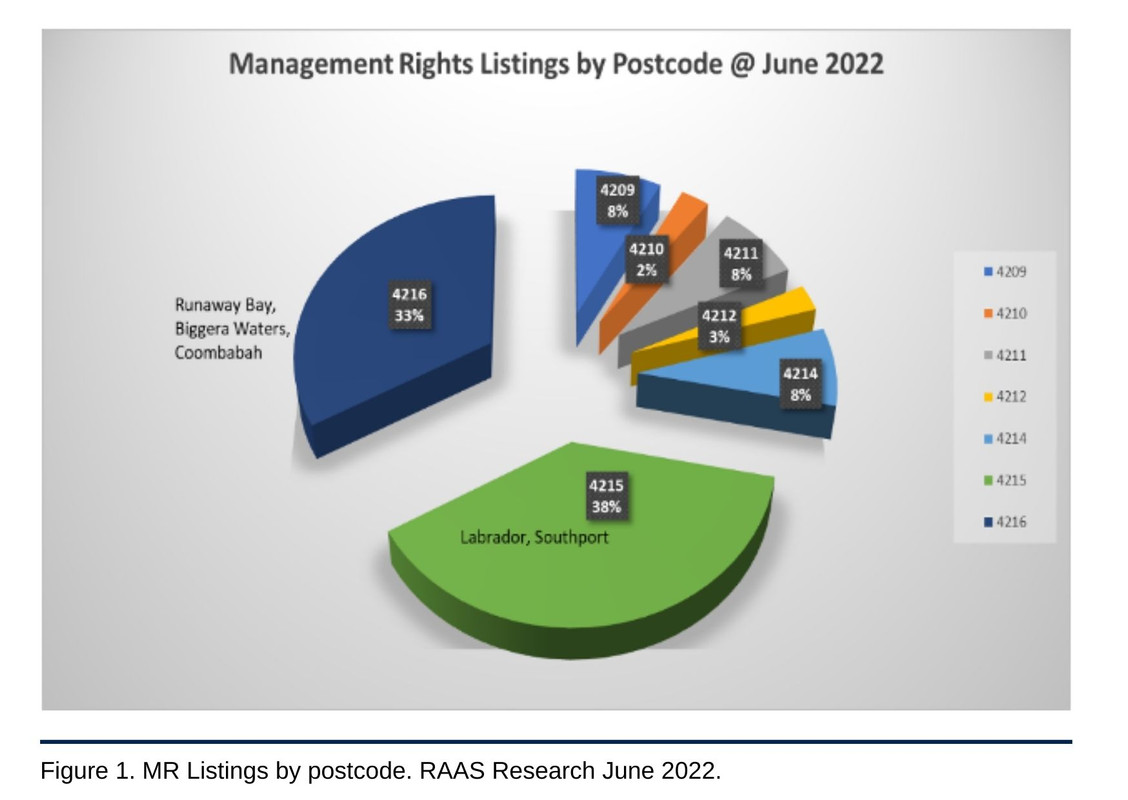
As at mid-June 2022, on the coast north of the Nerang River, there are 39 Management Rights businesses on the market (Data taken from www.theonsitemanager.com.au and www.accomproperties.com.au).
These can be broken down as 31 permanent complexes and 8 Resort/Holiday complexes for a total listed value of $46,701,755. As you can see from the table below, the largest percentage of complexes on the market comes from the Labrador/Southport postcode – 4215 - followed closely by the Runaway Bay/Biggera Waters/Coombabah postcode - 4216.
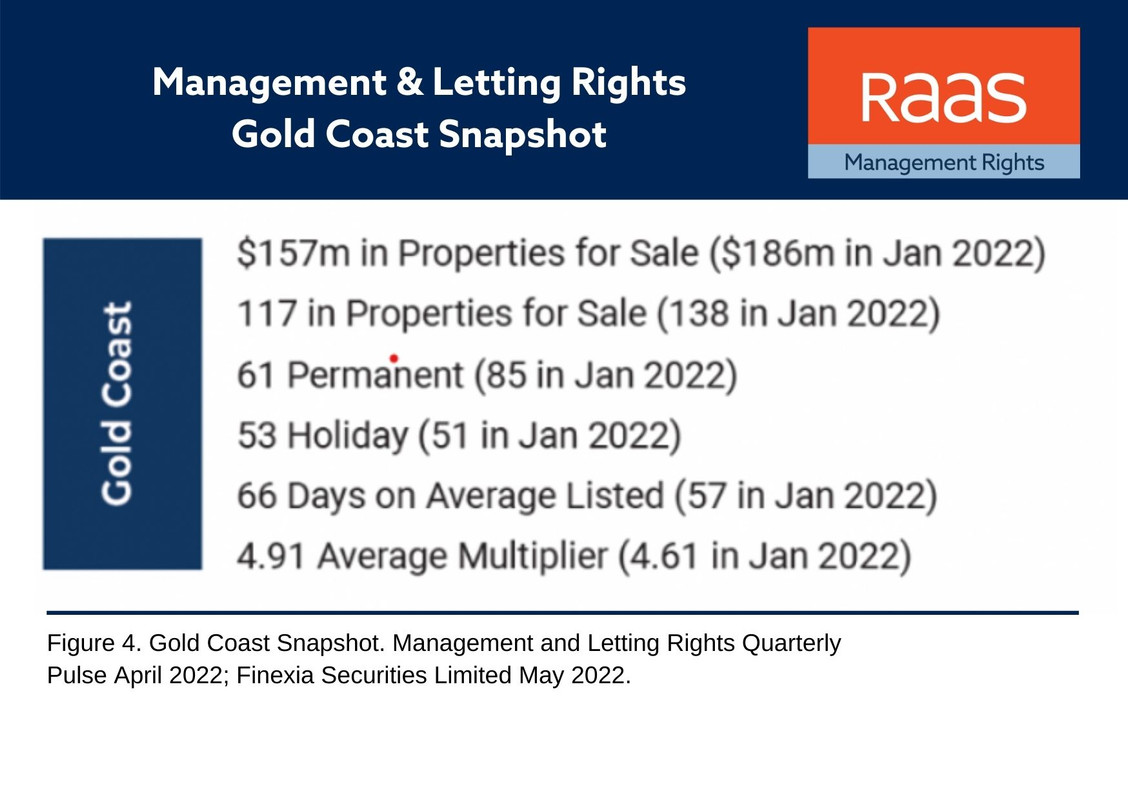
A recent Finexia Management and Letting Rights Quarterly Pulse – April 22 compiled by Finexia Securities Limited from data provided by the OnSite Manager Website indicated that in the quarter to April 2022, the number of resort complexes listed across the whole Queensland market rose compared to the previous 5 quarters, going back to the end of 2020, while the number of permanent complexes dropped significantly against prior quarter. The report goes onto suggest that this is because there is increased demand in permanent complexes therefore these are selling off the market more quickly reducing the overall stock available. This is somewhat borne out, when compared to their previous report in September 2021, which shows days on market at 68 for permanents compared to the recent quarter of 62 days, although this is up on the number of days on the market same time last year.
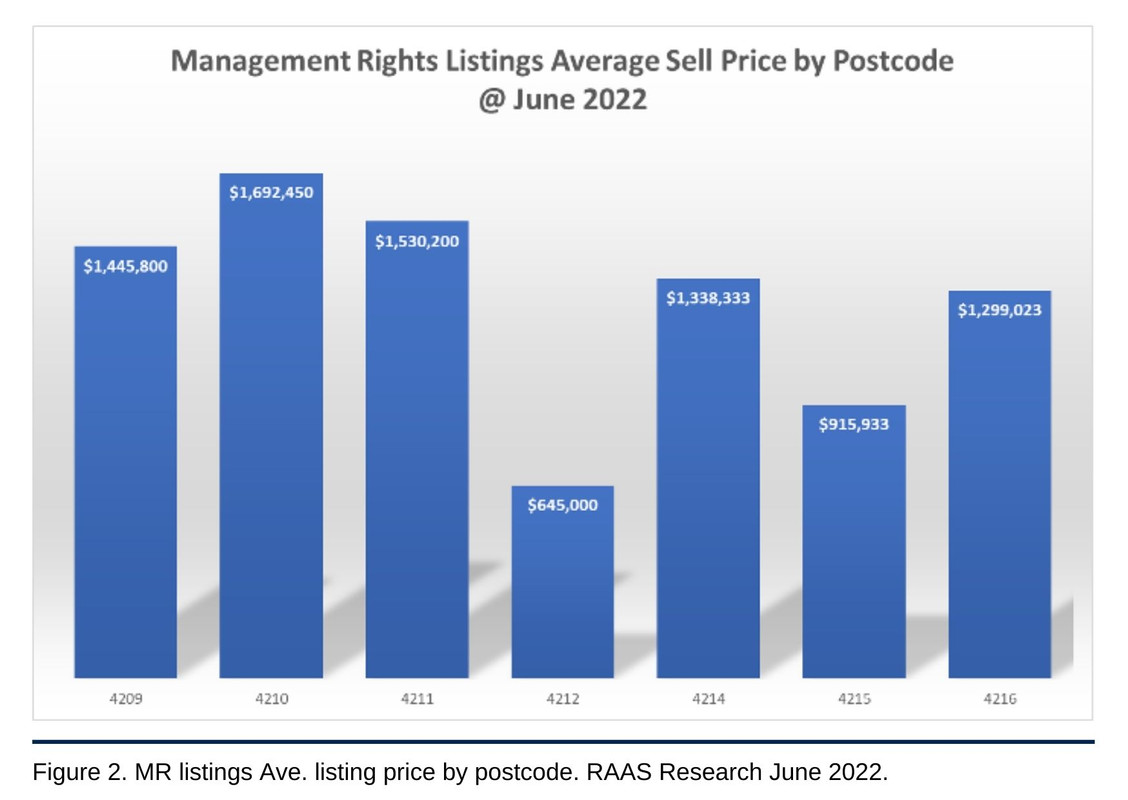
It is worth noting also that although there is less stock on the market in postcode 4216 (13) compared to 4215 (15), the total average selling price is 42% higher. Obviously the listed price is driven by the size and revenue of the complex and the average price in 4216 is skewed by larger complexes in that post code.
Overall, at $1,217,372 the average listed price in the region (across all types) is lower than the overall average listed prices from the previous quarter as identified by the Finexia report. Another point worth noting is the business multipliers being advertised. This is always something that everyone is interested in particularly when it comes time to sell.
The Finexia report identifies that, of the properties listed in the quarter to April 2022, the multipliers have either increased or decreased slightly based on the agreement type.
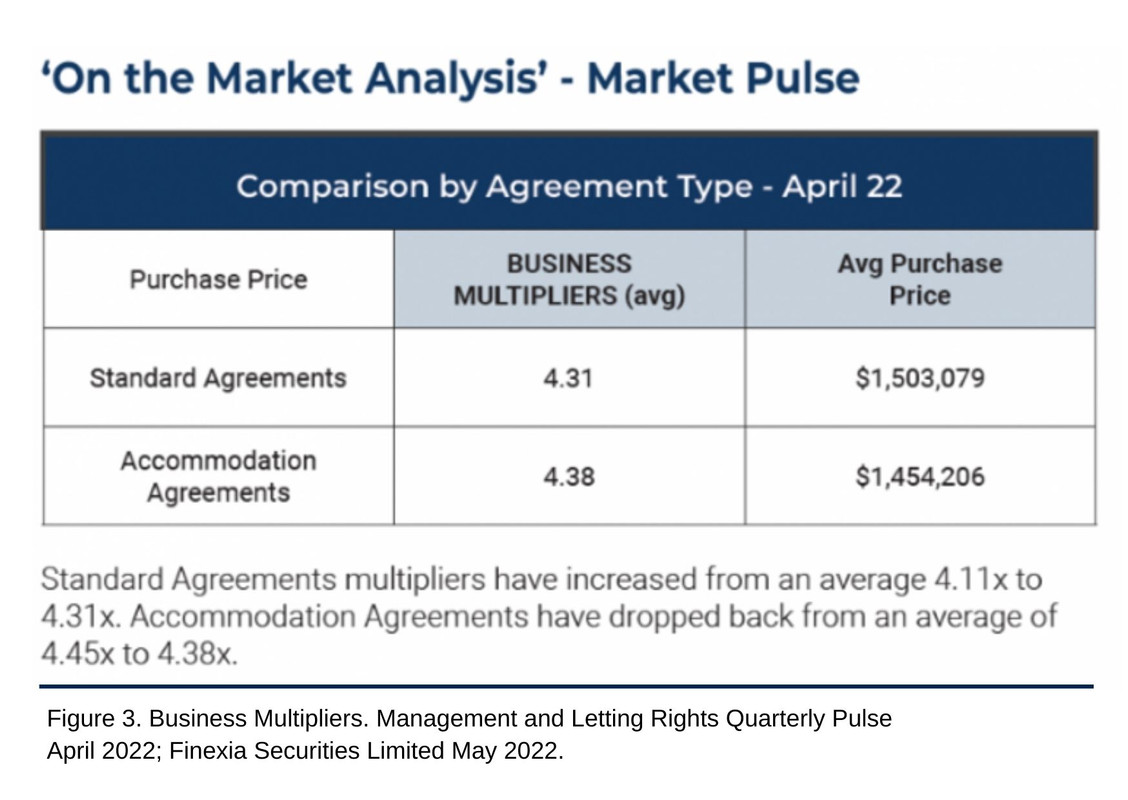
While the numbers shown above are right across Queensland you can see that the Gold Coast forms a significant part of the overall picture you can see below that the same held true for our market, but the average multiplier is higher than the state average.